Was this page helpful?
Vector Search Deployments
Before you work with Vector Search, you need to ensure that the Vector Search feature is enabled for your cluster. Enabling the feature involves adding Vector Search nodes to the cluster, with the possibility of deploying multiple nodes in each Availability Zone (AZ).
You can enable Vector Search on new and existing clusters, including free trial clusters.
Vector Search on Free Trial Clusters
You can enable Vector Search on a free trial cluster to explore similarity search without any cost. Free trial clusters support only the smallest available Vector Search instance size:
AWS —
t4g.medium(2 vCPUs, 4 GiB RAM)GCP —
e2-medium(2 vCPUs, 4 GiB RAM)
To get started:
Sign up for a ScyllaDB Cloud account if you don’t have one.
Create a free trial cluster and enable the Vector Search option (see Creating a New Cluster with Vector Search Enabled).
Connect to your cluster and follow the Quick Start Guide.
The free trial is limited to one cluster per account. For larger instance types and production workloads, upgrade to a paid plan.
Vector Search Availability
- ScyllaDB VersionVector Search is available on clusters running ScyllaDB 2025.4.3 or later.
- Cluster TypesVector Search can be enabled on Standard and X Cloud clusters. See Cluster Types.
- Instance TypesSee Supported Instance Types for a complete list of supported instance types.
Feature Compatibility Matrix
The following table shows which ScyllaDB version is required for each Vector Search feature:
ScyllaDB Version |
Features |
|---|---|
2026.2.0 |
Cassandra SAI vector index and LangChain compatibility, migrating indexes to use different set of options, vector similarity search for Alternator using lists of numbers. |
2026.1.0 |
Filtering, quantization, getting similarity values, real-time ingestion. |
2025.4.3 |
Internal authorization providing the maximal privacy of data. |
2025.4.0 |
Basic vector search: vector data type, HNSW indexing, ANN queries, per-partition and global indexes. |
Creating a New Cluster with Vector Search Enabled
You can create a new cluster with Vector Search enabled either through the ScyllaDB Cloud web UI or programmatically using the ScyllaDB Cloud API.
Go to cloud.scylladb.com and log in to your account, or sign up to create a new user account.
Click New Cluster to create a cluster.
Configure the required options:
Cluster name
Cloud provider: AWS or GCP
Cluster type: Standard or X Cloud
Enable the Vector Search option.

ScyllaDB Cloud will display available instance types with their pricing and the billing summary.
Choose the instance type.
Click Next.
Review the Billing Options page for your cluster. The page displays the number of Vector Search nodes and the associated costs.
Vector Search UI supports only on-demand billing. If you want to use your existing contract, please contact ScyllaDB Support.
Click Next to configure cluster properties.
Click Launch Cluster. It will take a few minutes for your cluster to launch.
When your cluster is deployed, go to the Connect tab. It displays instructions on how to connect to your cluster.
Choose Cqlsh from the left menu and follow the instructions.
To use the ScyllaDB Cloud API, you need to generate a personal API token for authenticating requests to the API endpoints. See Create a Personal Token for Authentication for details.
Get your account ID (
ACCOUNT_ID):curl -X GET "https://api.cloud.scylladb.com/account/default" \ -H "Authorization: Bearer YOUR_API_TOKEN"
Response looks like:
{
  "error": "",
  "data": {
     "accountId": 12345,
     "name": "my-account",
     "userId": "12345"
  }
}
Here 12345 is your
ACCOUNT_ID.Create a new cluster that includes the ``vectorSearch`` field in the API request body. Make sure to replace
ACCOUNT_IDandYOUR_API_TOKENwith actual values in the example below.curl -X POST "https://api.cloud.scylladb.com/account/{ACCOUNT_ID}/cluster" \ -H "Authorization: Bearer YOUR_API_TOKEN" \ -H "Content-Type: application/json" \ -d '{ "clusterName": "my-vector-cluster", "cloudProviderId": 1, "regionId": 1, "numberOfNodes": 3, "instanceId": 62, "replicationFactor": 3, "vectorSearch": { "nodeCount": 1, "defaultInstanceTypeId": 176 } }'
This will deploy dedicated vector search nodes in the cluster.
Connect to the cluster with cqlsh.
Go to https://cloud.scylladb.com/, choose your cluster and go to the Connect tab.
Choose Cqlsh from the left menu and follow the instructions.
Your cluster is ready to work with Vector Search!
Enabling Vector Search on an Existing Cluster
Note
Vector Search is supported on clusters running ScyllaDB 2025.4.3 or later. Before enabling Vector Search for an existing cluster, please verify that your cluster has been upgraded to version 2025.4.3.
To enable Vector Search on an existing cluster, you must deploy new Vector Search nodes. You can do it either through the ScyllaDB Cloud web UI or using the ScyllaDB Cloud API.
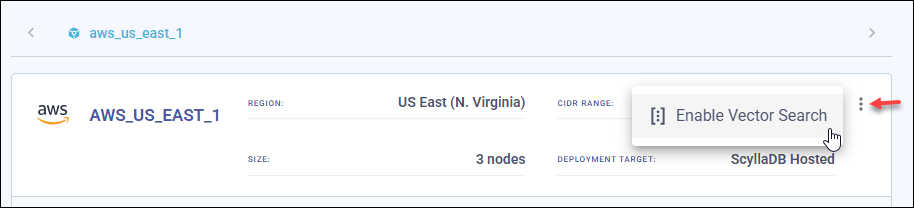
Select the cluster where you want to enable Vector Search to open the cluster details page.
Check the ScyllaDB Version. Vector Search is supported in ScyllaDB 2025.4.3 and later.
Choose Enable Vector Search from the three-dot menu in the datacenter overview section.
ScyllaDB Cloud will display available instance types with pricing.
Choose the Vector Search instance types you want to add to your cluster and click Add Vector Search Instances.
To use the ScyllaDB Cloud API, you need to generate a personal API token for authenticating requests to the API endpoints. See Create a Personal Token for Authentication for details.
Before you deploy new Vector Search nodes, you need to retrieve your account ID, cluster ID, and datacenter (DC) ID.
In the examples below, make sure to replace YOUR_API_TOKEN with your
actual access token value.
Get your account ID (
ACCOUNT_ID):curl -X GET "https://api.cloud.scylladb.com/account/default" \ -H "Authorization: Bearer YOUR_API_TOKEN"
Response looks like:
{
  "error": "",
  "data": {
     "accountId": 12345,
     "name": "my-account",
     "userId": "12345"
  }
}
Here 12345 is your
ACCOUNT_ID.List your clusters to get your cluster ID:
curl -X GET "https://api.cloud.scylladb.com/account/{ACCOUNT_ID}/clusters" \
   -H "Authorization: Bearer YOUR_API_TOKEN"
Response looks like:
{
  "data": {
    "clusters": [
       {
         "id": 6789,
         "name": "my-vector-cluster",
         "status": "ACTIVE"
       }
    ]
  }
 }
Here 6789 is your
clusterId.List the datacenters (DCs) for your cluster to get the DC ID.
curl -X GET "https://api.cloud.scylladb.com/account/{ACCOUNT_ID}/cluster/{CLUSTER_ID}/dcs" \
   -H "Authorization: Bearer YOUR_API_TOKEN"
Response looks like:
{
  "data": {
    "dataCenters": [
       {
         "id": 222,
         "name": "us-east-1a",
         "status": "ACTIVE"
       }
    ]
  }
}
Here 222 is the
dcIdyou need for vector store operations.Deploy Vector Search nodes.
curl -X POST "https://api.cloud.scylladb.com/account/{ACCOUNT_ID}/cluster/{CLUSTER_ID}/dc/{DC_ID}/vector-search" \
  -H "Authorization: Bearer YOUR_API_TOKEN" \
  -H "Content-Type: application/json" \
  -d '{
     "nodeCount": 1,
     "defaultInstanceTypeId": 176
  }'
Connect to the cluster with cqlsh.
Go to https://cloud.scylladb.com/, choose your cluster and go to the Connect tab.
Choose Cqlsh from the left menu and follow the instructions.
Resizing a Vector Search Cluster
You can resize your Vector Search deployment by changing the number of nodes or switching to a different instance type. Resizing is available through the ScyllaDB Cloud web UI or the ScyllaDB Cloud API.
Select the cluster where you want to resize Vector Search to open the cluster details page.
Choose Resize Vector Search from the three-dot menu in the datacenter overview section.
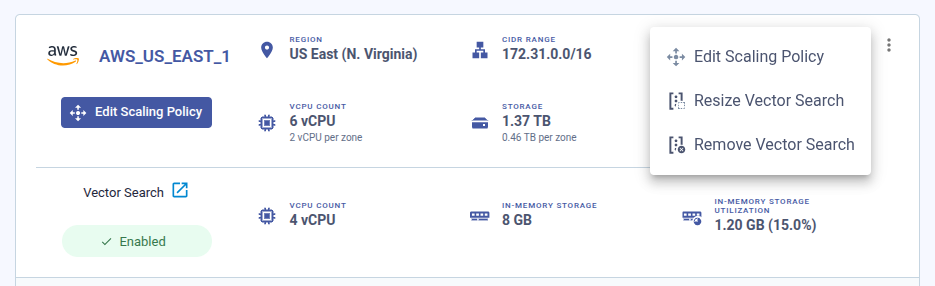
Choose the new instance type and/or adjust the number of Vector Search nodes.
Confirm the resize operation. The operation is asynchronous — you can monitor its progress in the cluster’s activity log.
Send a PATCH request to the Vector Search endpoint for the target
datacenter. The request body accepts two parameters:
nodeCount(integer, 1–27) — the desired number of vector search nodes.defaultInstanceTypeId(integer) — the instance type ID. Use thetarget=VECTOR_SEARCHquery parameter on the deployment endpoint to list available instance types.
curl -X PATCH "https://api.cloud.scylladb.com/account/{ACCOUNT_ID}/cluster/{CLUSTER_ID}/dc/{DC_ID}/vector-search" \
   -H "Authorization: Bearer YOUR_API_TOKEN" \
   -H "Content-Type: application/json" \
   -d '{
      "nodeCount": 3,
      "defaultInstanceTypeId": 177
   }'
A successful response returns HTTP 202 (Accepted) with a
ClusterRequest object. You can
track the operation status using the
returned request ID.
Disabling Vector Search
You can disable Vector Search through the ScyllaDB Cloud UI or using the ScyllaDB Cloud API.
Choose Remove Vector Search from the three-dot menu in the datacenter overview section to disable Vector Search on your cluster.
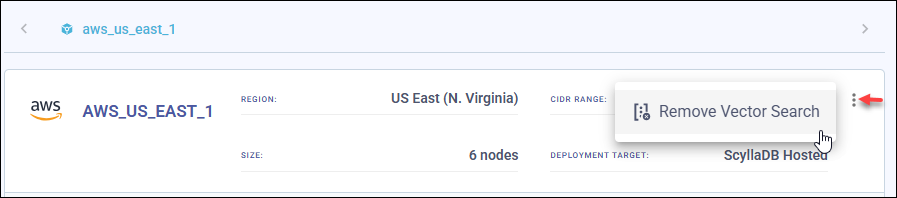
Disabling Vector Search removes all the Vector Search nodes from your cluster.
Remove Vector Search nodes one by one from the cluster.
To remove all Vector Search nodes from a specific datacenter, send
a DELETE request to the Vector Search endpoint. This operation is
asynchronous and returns a ClusterRequest object that you can monitor
for progress.
curl -X DELETE "https://api.cloud.scylladb.com/account/{ACCOUNT_ID}/cluster/{CLUSTER_ID}/dc/{DC_ID}/vector-search" \
   -H "Authorization: Bearer YOUR_API_TOKEN"
The request schedules the removal of all Vector Search nodes from the
specified datacenter. A successful response returns HTTP 202 (Accepted)
along with a ClusterRequest object that describes the operation.
Monitoring Vector Search Clusters
You can monitor Vector Search clusters and nodes through the dedicated Vector Search dashboard provided in the ScyllaDB Monitoring Stack. The dashboard is available from the Monitoring tab in your cluster’s view.
See Monitoring Clusters for details about the ScyllaDB Monitoring Stack.
Dashboard Overview
The Vector Search dashboard provides an at-a-glance overview of vector search health and performance. It includes the following panels:
Status — Whether the vector search service is online (green) or offline (red).
# Indexes — The total number of vector indexes currently loaded across the cluster’s vector search nodes.
Disk Usage — Storage consumed by vector search data on the node’s disk, shown as a pie chart (used vs. free) and as an absolute value.
Memory Usage — Memory consumed by the vector search process, including in-memory HNSW indexes. Monitor this to determine when to scale up or enable quantization.
CPU Usage — CPU utilization of the vector search nodes. High CPU usage may indicate heavy query traffic or bulk index builds.
The dashboard supports filtering by datacenter (DC), node, and index using the variable selectors at the top of the page.
Vector Search Metrics
Vector search nodes export application-level Prometheus metrics alongside standard infrastructure metrics. You can use these metrics to monitor query performance, index growth, and write throughput.
Application metrics
The following metrics are exported by the vector search service:
Metric |
Type |
Labels |
Description |
|---|---|---|---|
|
Histogram |
|
Latency of ANN search requests within the vector search node. Uses fine-grained buckets from 0.1 ms to 10 s. |
|
Gauge |
|
Current number of vectors in each index. Updated when the metrics endpoint is scraped. |
|
Counter |
|
Number of index modification operations. The |
Infrastructure metrics
Each vector search node also runs standard Prometheus exporters:
Node Exporter — hardware and OS-level metrics (CPU, memory, disk, network).
Process Exporter — per-process metrics (CPU, memory, I/O for the vector search process).
Example PromQL Queries
Use the following PromQL queries to monitor key aspects of your vector search deployment:
Search latency (p99):
histogram_quantile(0.99,
  sum(rate(request_latency_seconds_bucket[5m])) by (le)
)
To get per-index latency, add label selectors:
histogram_quantile(0.99,
  rate(request_latency_seconds_bucket{keyspace="my_ks", index_name="my_idx"}[5m])
)
Search request rate (queries per second):
sum(rate(request_latency_seconds_count[5m]))
Vector insert throughput per index:
rate(index_modified_total{operation="insert"}[5m])
Total write throughput (inserts + updates + removes):
sum(rate(index_modified_total[5m])) by (keyspace, index_name)
Current number of vectors per index:
index_size
What to Watch For
Rising p99 search latency — May indicate memory pressure, growing index size, or resource contention during bulk writes. Consider quantization to reduce index memory, or scale to a larger instance type.
Sustained high insert/update rate — During bulk ingestion or initial index build, a high
index_modifiedrate is expected. If the rate remains elevated after ingestion completes, investigate whether your application is performing unnecessary re-inserts.Index size plateaus or drops unexpectedly — A sudden drop in
index_sizemay indicate bulk deletes or an index rebuild. Verify that the drop is intentional.High memory utilization — HNSW indexes are held in memory. As indexes grow, memory usage rises. If utilization stays above 80 %, consider enabling quantization to shrink the in-memory footprint, or resize to an instance type with more RAM.
Elevated CPU utilization — Spikes during bulk index builds or heavy query traffic are normal. Sustained high CPU outside of ingestion windows may mean the instance is undersized for the query load. Scale up the instance type or add more vector search nodes.
Disk usage approaching capacity — While the HNSW index lives in memory, vector search nodes also store data on disk. Monitor disk usage to avoid running out of space.
Status offline — If the Status panel shows offline, check that the vector search nodes are running and that network connectivity between storage nodes and vector search nodes is intact.
What’s Next
Working with Vector Search — learn the CQL syntax for vector tables, indexes, and ANN queries.
Quick Start Guide — end-to-end walkthrough of your first similarity search.
Reference — supported instance types, CQL reference, and API endpoints.